When I sit down at the radio, the first question is usually the same: where is it open right now? Most of the time I just want a quick hint about which band to try first, without digging through solar numbers, SFI, A and K indices or MUF charts.
That is the reason behind the new Band Conditions tool in HAM-Toolbox. It is built on the live DXCluster feed that HAM-Toolbox already uses, and it focuses on one thing: a clear picture of what is actually being worked from your location right now.
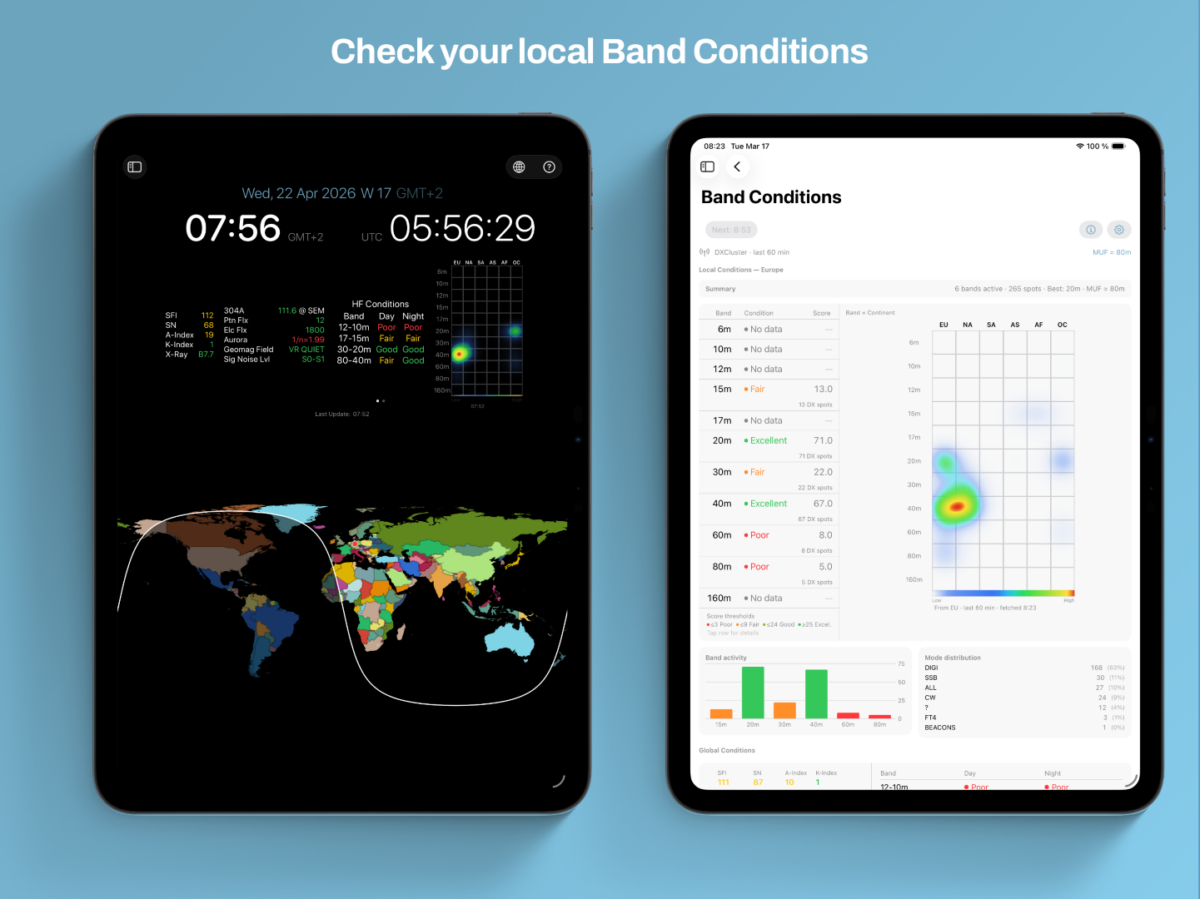
A view built around your location
Global propagation numbers describe the ionosphere in general. The new view describes your station based on real QSOs other operators are making in the last hour. Each band gets a simple rating from poor to excellent, so one look is usually enough to decide whether it is worth a call or whether another band is the better bet.
A heatmap that shows the openings
Next to the ratings sits a Band × Continent Heatmap — blue for quiet, red and yellow for lively. It is a small addition, but in practice it has become the part I check first: one glance tells you whether Europe is busy on 20 m, whether an opening to North America has started, or whether things are simply quiet for now.
Right inside the HAM-Clock
Rather than only adding a separate tool, I put this where I naturally look anyway: the HAM-Clock. Swipe once for Global Conditions, the familiar worldwide overview. Swipe again for the new Local Conditions view with your personal ratings and the heatmap. Two views, one gesture.
It is the tool I wish I had had earlier, and I hope it makes it a little easier to find those unexpected QSOs on bands you might otherwise have skipped.
Available now on iPhone, iPad and Mac. Open the HAM-Clock, swipe to Local Conditions, and let me know how it behaves at your station.
73,
Jan Roskosch